evaluateColor issue

Hi, dear Community.

Please, can you tell what’s wrong with my implementation of evaluateColor style option?
It doesn’t set my color instructions… it looks like evaluateColor function is never fired.

Here is a sendCastle link.

And if there is any problems with sendCastle here is a code:


var viewer = new Cesium.Viewer('cesiumContainer', {
        terrainProvider: Cesium.createWorldTerrain()
});

const style = {   
        color: {
          evaluateColor : function(feature, result) {
            return Cesium.Color.clone(Cesium.Color.YELLOW, result);
            // return Cesium.Color.YELLOW
          }
        },
        pointSize: 6
      };

const tilesetDeck = new Cesium.Cesium3DTileset({       
        url: Cesium.IonResource.fromAssetId(618442),
        skipLevelOfDetail: 10000,
        dynamicScreenSpaceErrorFactor: 10,
        foveatedScreenSpaceError: true,
        foveatedConeSize: 10,        
})
      tilesetDeck.style = new Cesium.Cesium3DTileStyle(style)
      viewer.scene.primitives.add(tilesetDeck)
      tilesetDeck.pointCloudShading.attenuation = true;
      tilesetDeck.pointCloudShading.eyeDomeLighting = true;

viewer.scene.primitives.add(tilesetDeck)
setTimeout(() => {
  viewer.camera.flyToBoundingSphere(tilesetDeck.boundingSphere, new Cesium.HeadingPitchRange(0, -0.5, 0), { duration: 1000 })
}, 1000)

@kiril4913

Welcome to the community! Thank you for the detailed post - sharing your source code and a sandcastle example is really helpful.

I wonder if I am missing something here… I just read through our 3D Tiles Styling Language for the Cesium3DTileStyle object in our API. I did not see any references to the member evaluateColor. Can you show me where this can be found in our API or styling guide?

In the meantime, here is a sandcastle demo that shows how to update the color of each point in the LIDAR dataset.

Let me know if you have any other questions or concerns. I am looking forward to learning more!

-Sam

Thank you very much for your reply.

Here is a link where I’ve found and a screenshot of the use case examples:

Also thank you for your sendcastle example but I know this kind of solution and I need more complex styling with gradient by several colors depending on point’s z-coordinate.

@sam.rothstein
Sorry, I didn’t mention you in my reply previously. Please take a look.

@kiril4913

Thanks for the additional details. I appreciate that you sent over the documentation :grinning: I somehow had trouble finding that part of our documentation myself.

One difference that I am noticing - it seems like in our documentation we define style as a Cesium3DTileStyle object before updating it. In the code that you shared, it does not appear like you are doing this. The following lines should suffice.

var style = new Cesium.Cesium3DTileStyle();
style.color = {
    evaluateColor : function(feature, result) {
        return Cesium.Color.clone(Cesium.Color.YELLOW, result);
    }
};
style.pointSize = 6;

Please give this a try at let me know how it works. On a personal note, I am curious to learn more about how the function created in evaluateColor is called. If you have some insight into this, I would appreciate if you shared it with me.

-Sam

@sam.rothstein
It didn’t help. Nothing changed.
Here is a version of sandcastle link with recommended workaround.

@kiril4913

I think the second part of my last response is becoming more and more relevant. Moving forward, we need to have a better understanding of how evaluateColor is being called. I am going to take some time to investigate this further.

-Sam

@sam.rothstein
Great! Thank you. I’ll be waiting.

@kiril4913

As you may know, point clouds are shaded on the GPU. Thus, evaluateColor actually will not work for point clouds. What kind of style are you going for? We might be able to find a workaround using other tools in Cesium3DTileStyle.

-Sam

@sam.rothstein

Dear Sam, thank you for your reply.
In this case we need to colorize points by height (altitude) in gradient style like Potree does. Here is example.

Here is new sandcastle link where I’ve added our current color solution (whith comments) without gradient and anchoring to POSITION.z propperty and commented case with POSITION_ABSOLUTE.z. So first case is can be used some how but if I start to zoom in blue color appears on the ground and it’s weird. It looks like some blue points are under green ones and at the same time the blue points can be under the green ones. Accoding to color conditions expression it shouldn’t be so… why this happening and how can I avoid this?

Here is a screen of the issue:

At the same time we faced problem with picking point by mouse click.
Data set used in this sandcastle is hosted in ion server. It was a *.las file exported from Norbit drone lidar data with a lot of parameters. Here they are on the screen below.

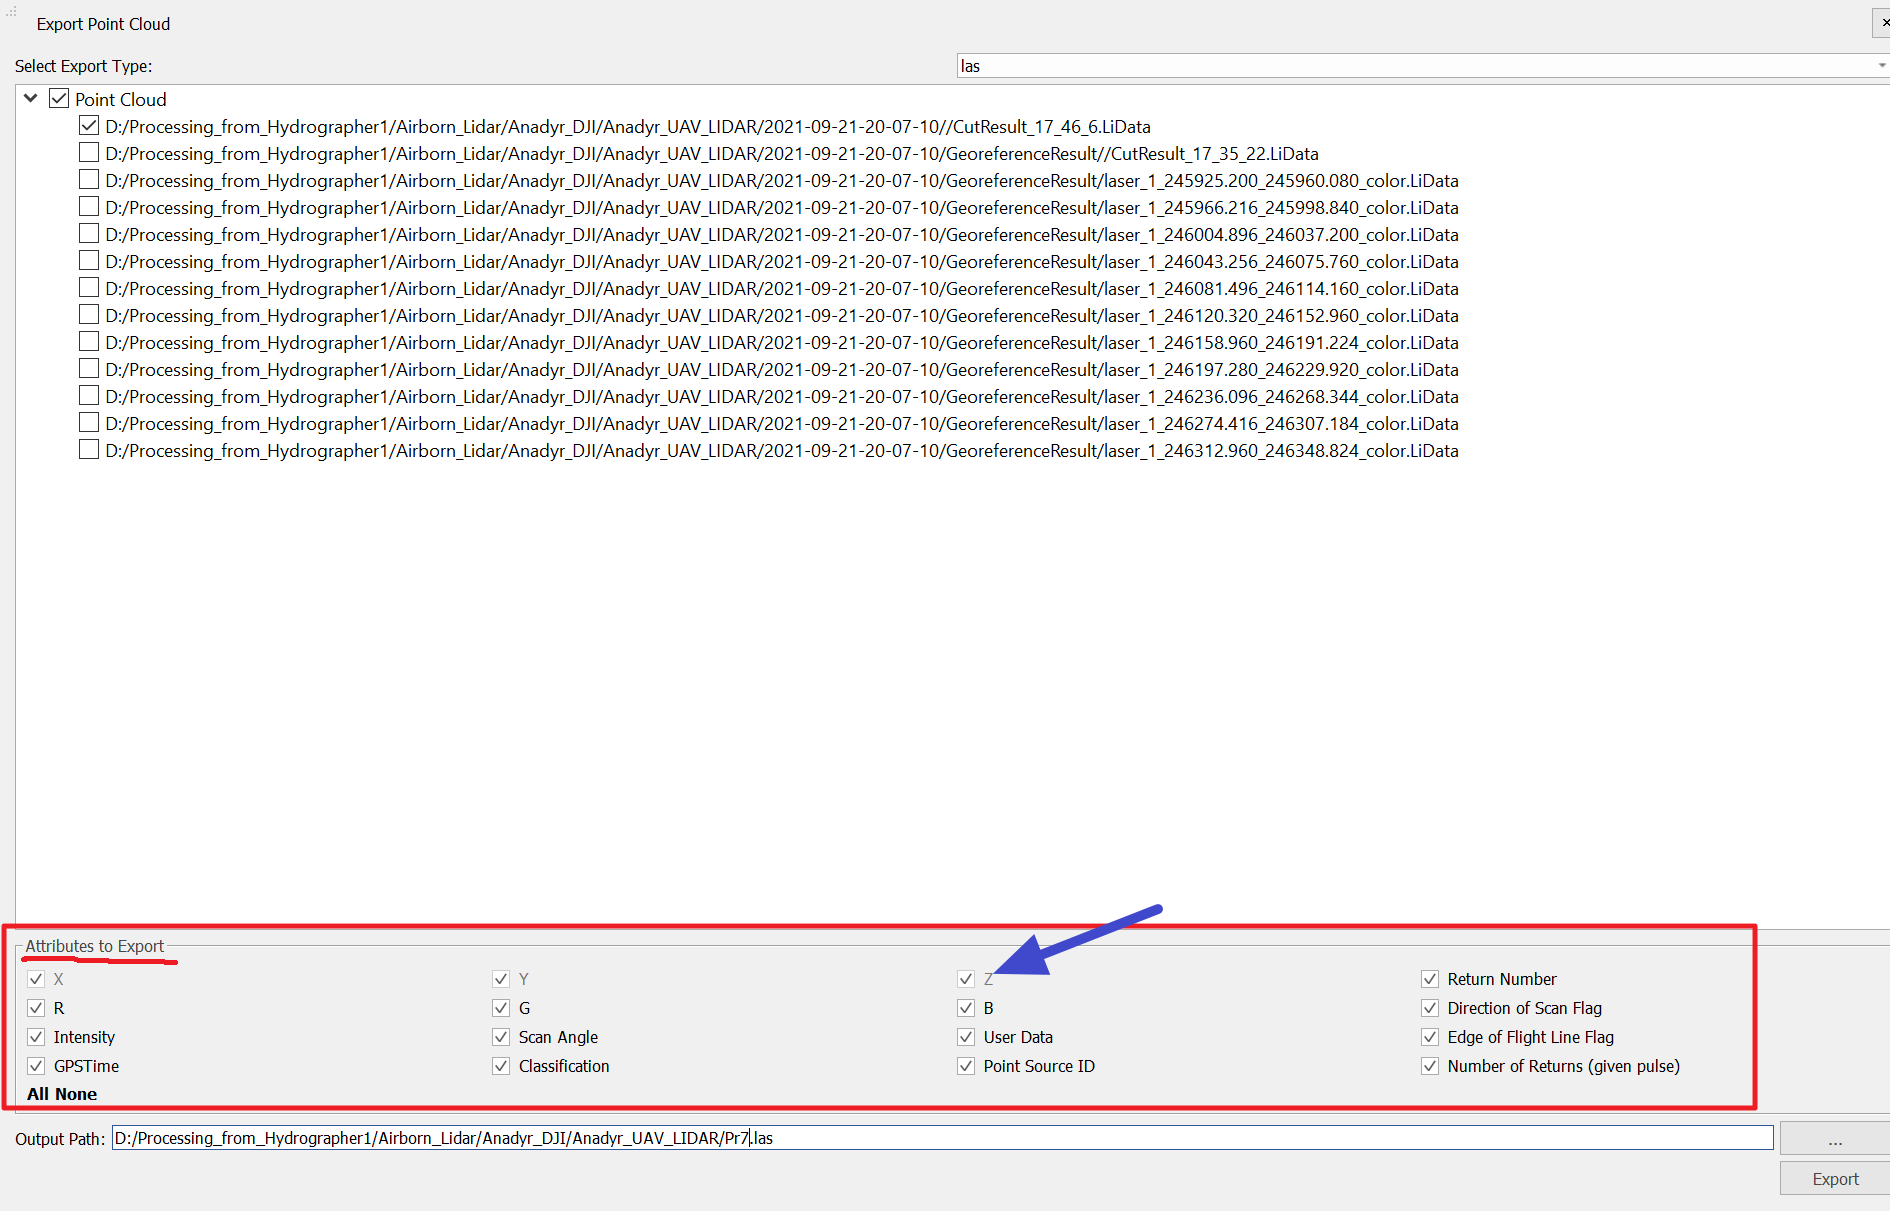
So we expect that after importing our las data to ion we’ll have access to these properties But in real we don’t. I’ve studied the common previous cases on community forum and found out that there has to be a batchedTable and every point must have batch_id. In this case I can see that _batchTable is undefined and there is 0 features in the tileset. But as you can see in the upper screen the point source id property is checked.

So there are some additional questions:

  • How can we add to ion my las files and it recognize all my properties?
  • Should we convert our las files to another format and batch them previously? If yes then what software you would recommend?
  • How can we create features to interact with them in Cesium?
  • Why Cesium shows the photonometric point colors if it can’t see batched properties? Does it mean that nevertheless we can get point properties anyway?

Updated. Here is a link to original *.las file on google drive for investigation.

also you can set color as this sample - as I understand - params color: getting string data for correct work
const style = {
//“color” : “color(‘#ffff00’)”, // this work also if will need solid color
color :`
rgb(min(${POSITION}.x, 0.25) * 255,
max(${POSITION}.y, 0.1) * 255,
max(${POSITION}.z, 0.1) * 255)
pointSize: 6
};

but if you need colored from other data - this Sandcastle sample may be can help
color gradient point cloud
OR from specs
https://github.com/CesiumGS/3d-tiles/blob/main/specification/Styling/README.md

@dihand
Thank you for solution! But if you will start to zoom in then you’ll get total mess of mispointing colors. Where points of one color will be on different Z layers.

@kiril4913 Yes - I see this - I think this dependencies from tile algorithm optimisation - if you will camera rotation - color line will have offset dependencrs from camera racurs.
My be this can particaly solution if set more tile size. Or playing with different color params.

@sam.rothstein
Please give me an answer becuase now it looks like Cesium is not reasonable product and it will be better choose the Potree solution.

@kiril4913

Have you tried @kiril4913’s most recent suggestion? Increasing the tile size of the data that you are streaming is a great suggestion. I expect that this will help remove at least some of the color-related errors.

-Sam

@sam.rothstein

What about all other questions I’ve asked here? About missing las properties and batch table? Not correct displaying colors by z-coordinate?

I’ve checked the las file in Potree viewer and LasTools and I can see these properties, but ION doesn’t. If we decide to use your service what should we do to solve this issue?

@kiril4913

Apologies for not getting to your questions! I did not realize that they were still relevant after our discussion with @dihand. I really appreciate your patience. I am going to do my best to get to all of your questions and point you towards the correct resources.

Color Expressions

I took a look at the sandcastle demo that you shared above. From what I can tell, the POSITION_ABSOLUTE member gives you your desired result. I would recommend sticking with this solution for your application.

It seems like the POSITION member returns the position of each lidar point relative to the Viewer. Thus this position changes as your move the camera, yielding a mix of green and blue points. While this is appropriate for many use cases, it might not be the best member to use here.

Point Cloud Metadata

Intuitively displaying point cloud metadata has historically been a pain point for our community. However, I think that we will be able to find a solution that works for you. A few thoughts and questions:

  • I would love to learn more about how you are importing your data to Cesium ion. Can you please share some more details?
  • Are you manually defining and updating _batchTable?
  • @Matt_Boyd-Surka is more familiar with our data pipelines than I am. @Matt_Boyd-Surka have you seen similar issues with .las file uploads in the past? Any suggestions for uploading this data to Cesium ion?
  • Moving forwards, we should create a “best practices” guide for uploading lidar data to Cesium ion.
  • Keep in mind that you can also import local files into CesiumJS. I suggest that you try this for your lidar dataset and see if the errors persist. This would be helpful information for our debugging process.

Thank you for taking the time to bring these questions to our community! I am looking forward to learning more about your use case. Please reach out if any other questions come up.

-Sam

Hi @kiril4913, below are some clarifications regarding point clouds and metadata.

Our tilers can generate a BATCH_ID based on the Classification attribute, but this is disabled in ion. Even if you were to use BATCH_ID, however (by using the on-premises tiler or by generating 3D Tiles yourself), that would only make it possible to pick a batch of points and get metadata for that batch. This approach would not work well for per-point metadata, because it would overload the CPU with potentially millions of Cesium3DTileFeature objects. So, you cannot currently pick a point from a point cloud on the screen and get its properties.

We have a ticket open to track arbitrary per-point metadata picking, as it has been requested previously, and we do plan to support it in the future. I do not have a timeline for it at the moment, though.

On another subject, the Intensity field is accessible for styling. Please see this example. An example of how to use Classification for styling is available here.

I see the problems around using POSITION (when the camera gets close) and POSITION_ABSOLUTE (doesn’t use a frame of reference that is upright relative to the surface of the Earth) to style your points. I don’t have a good solution for you at this time, but we will investigate further and provide updates here.

Thanks,
Matt

@sam.rothstein

Dear Sam, thank you very much for your help! It represents the Cesium team like really helpful and customer friendly organization.

The ABSOLUTE_POSITION case solution has one lack, the color spreads not by altitude (height) but at some an angle to the horizon… and I don’t know how to convert the POSITION_ABSOLUTE.z property to real height. And how can I get programtically the borders for condition expressions? Now they set mandatory… is this means that we need to maintain special table in database for every tileset and it’s metadata? In fact it will be much easier to solve the issue we can get to height (altitude) property of points…

Answers to questions:

  • I would love to learn more about how you are importing your data to Cesium ion. Can you please share some more details?
    Well, I’ve chose the “Add data => Add files” and Ion defined the point cloud data file type, then I removed the draco comperssion check box and started to upload and processing the file, then in my datasets list appeard the tileset item. By the way in one of my previous replies I’ve attached the original las file, you can try all the way by yourself and totally investigate the issue step by step and check the las file.

  • Are you manually defining and updating _batchTable ?
    No, I didn’t. I’ve just exported the data from my lidar’s data file with all properties. I want to pay your attention that I can see all these properties in other softwares as LasTools and Potree. I even can interact with them.

  • Keep in mind that you can also import local files into CesiumJS. I suggest that you try this for your lidar dataset and see if the errors persist. This would be helpful information for our debugging process.
    I will try it tommorrow.

Thank you one more time.

@Matt_Boyd-Surka, @sam.rothstein
Well, this is a very bad news because in fact it makes Cesium useless for operating with point clouds if I can’t interract with custom point’s properties or real coordinates (position and position_absolute are useless in real cases, when it needs to interract with real coordinates system). Classification and intensity are too few to ensure to solve a sufficient list of our tasks.