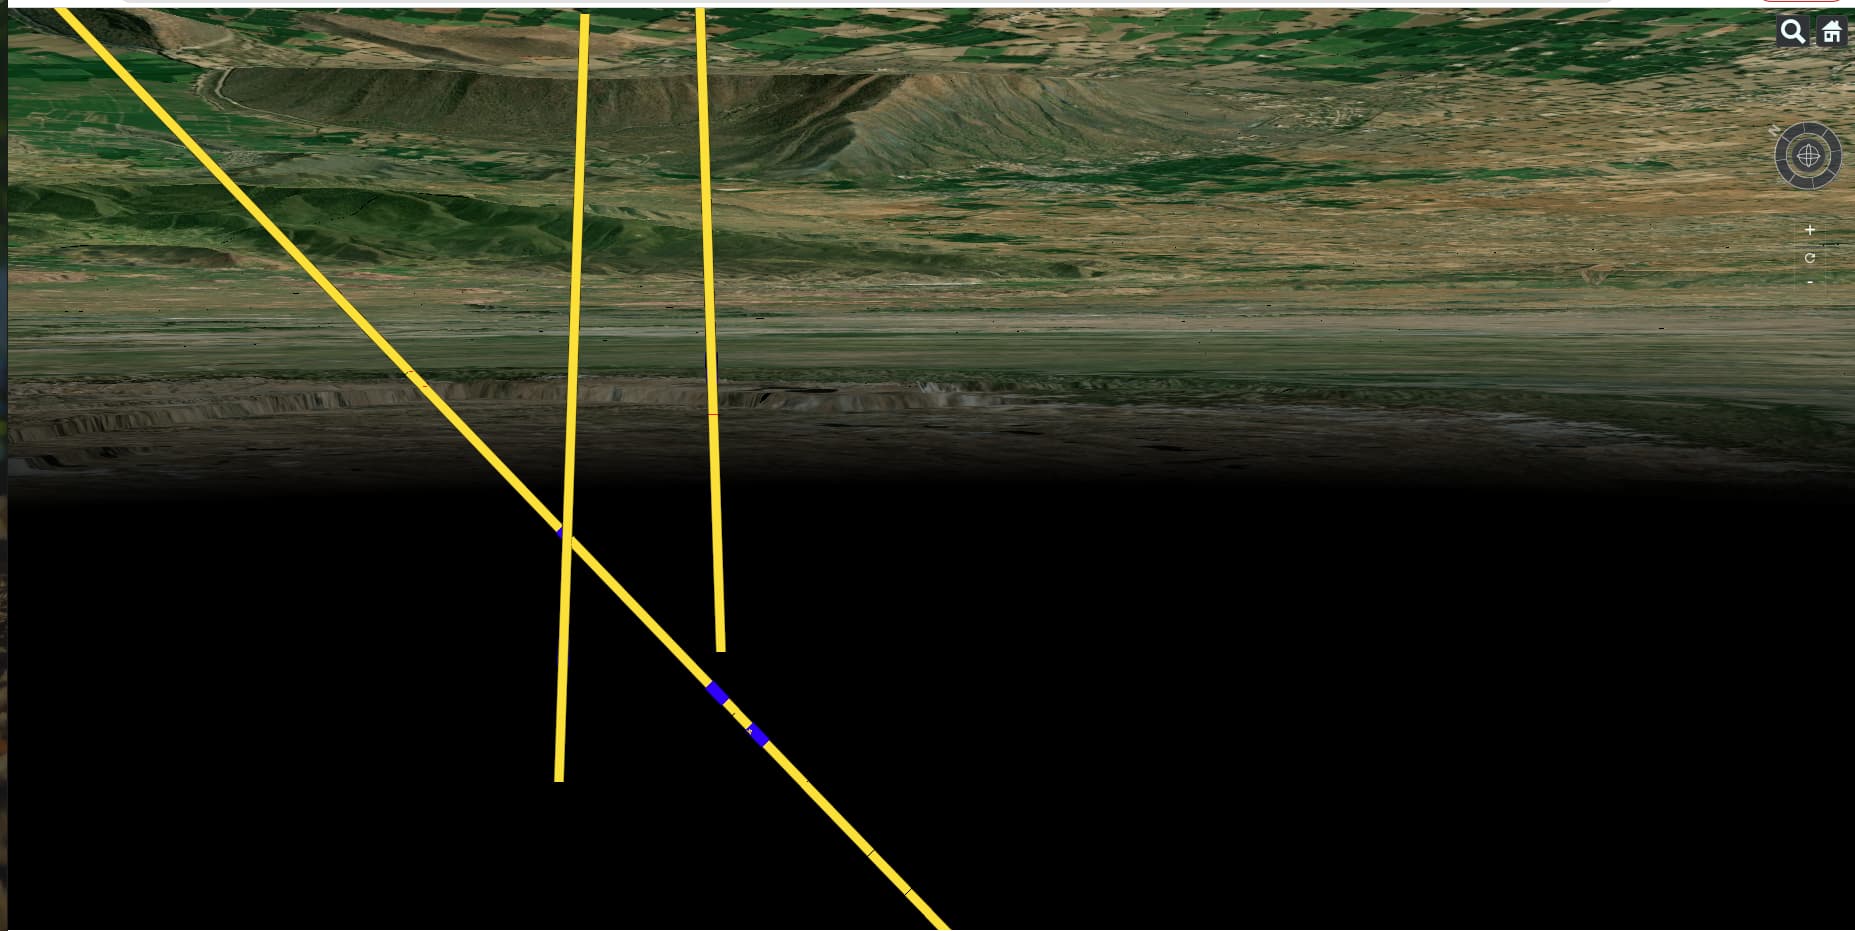
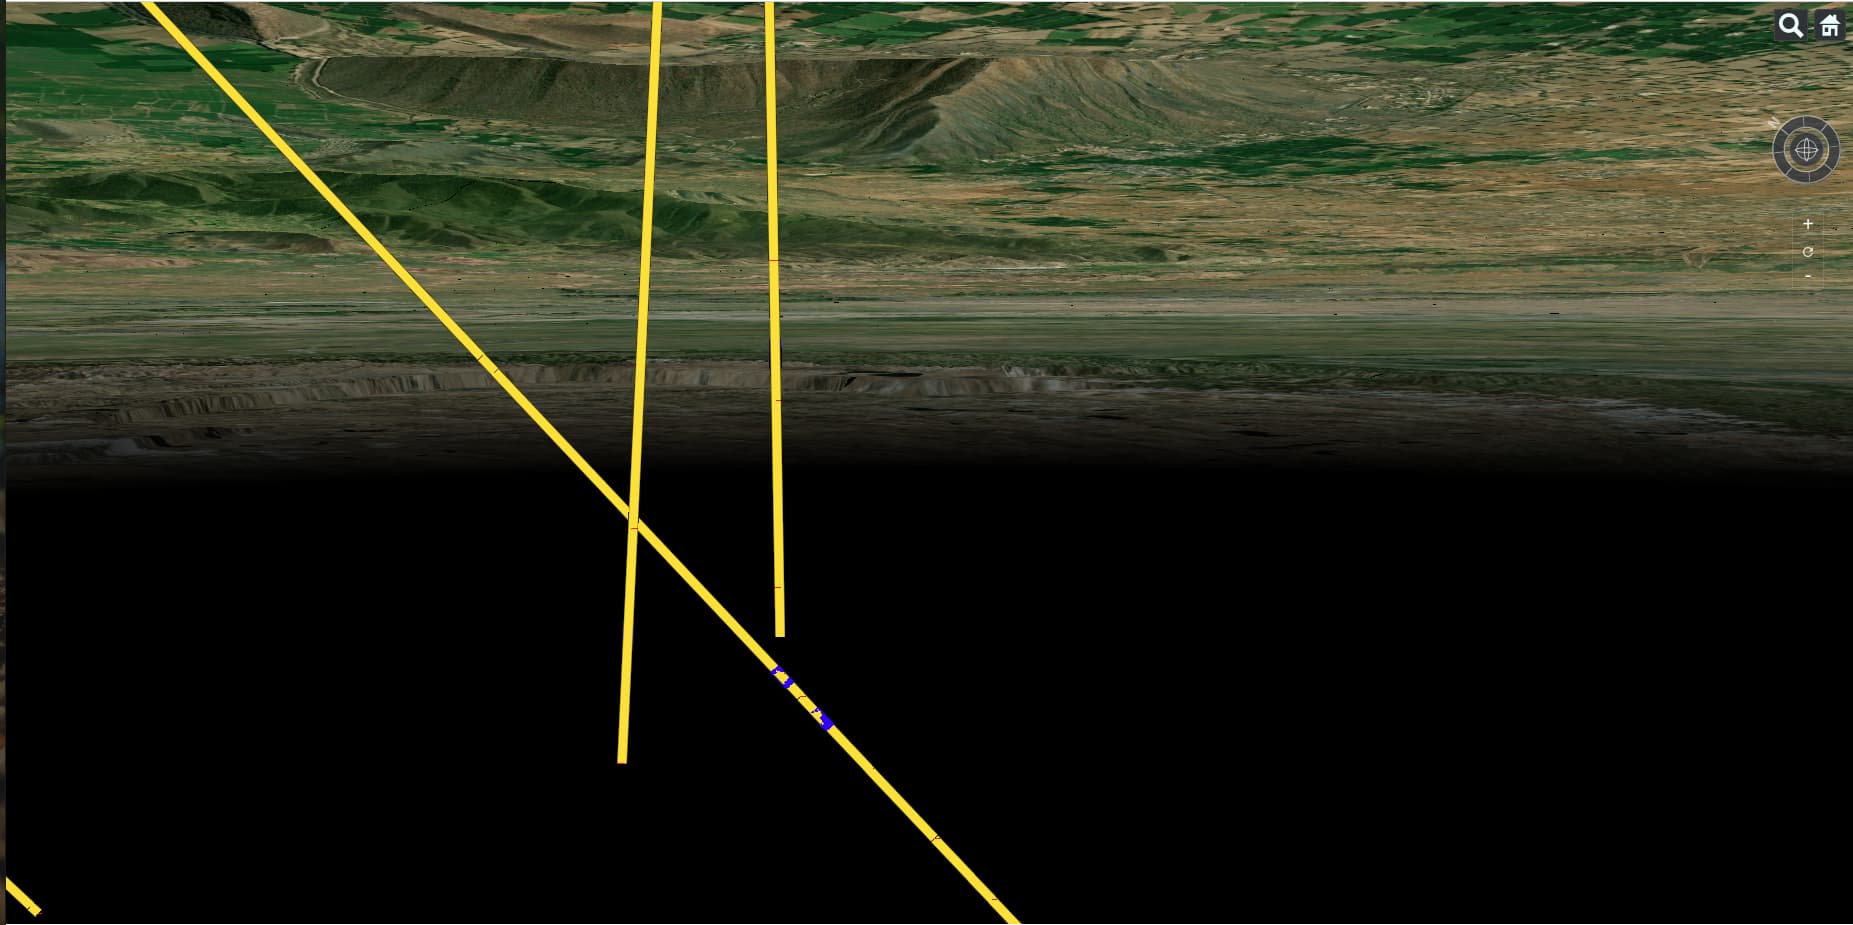
When we create two polylines at same coordinates.There is the rendering issue to display the second polyline.
Here are the images:


Sample Data from Borehole.csv
| sr_no | borehole_no | latitude_dd | longitude_dd | rl_collar_m |
|---|---|---|---|---|
| 3 | RJPG-3 | 27.1482777777778 | 76.485 | 318.5 |
Sample Data from lithology33.csv:
| sr_no | borehole_no | from_depth | to_depth | rock_name | lon1_ | lat1_ | lon2_ | lat2_ |
|---|---|---|---|---|---|---|---|---|
| 6097 | RJPG-3 | 0 | 10.4 | Grey dolomitic marble with tremolite | 76.485 | 27.148277778 | 76.4850660613022 | 27.1482189947456 |
| 6098 | RJPG-3 | 10.4 | 12.7 | Grey dolomitic marble | 76.4850660613022 | 27.1482189947456 | 76.4850806710133 | 27.1482059945986 |
| 6099 | RJPG-3 | 12.7 | 18.2 | Massive cherty quartzite. | 76.4850806710133 | 27.1482059945986 | 76.4851156072789 | 27.1481749072845 |
| 6100 | RJPG-3 | 18.2 | 112.3 | Grey dolomitic marble with tremolite | 76.4851156072789 | 27.1481749072845 | 76.485713335023 | 27.147643030261 |
| 6101 | RJPG-3 | 112.3 | 116.3 | Grey dolomitic marble and whiteSiliceous dolomitic marble. | 76.485713335023 | 27.147643030261 | 76.4857387432162 | 27.1476204211922 |
| 6102 | RJPG-3 | 116.3 | 207.65 | White siliceous dolomitic marble. | 76.4857387432162 | 27.1476204211922 | 76.4863190028275 | 27.1471040853386 |
| 6103 | RJPG-3 | 207.65 | 229 | White siliceous dolomitic marble withtremolite. | 76.4863190028275 | 27.1471040853386 | 76.4864546190585 | 27.146983408799 |
| 6104 | RJPG-3 | 229 | 250 | Grey dolomitic marble and white siliceous dolomitic marble with tremolite and thin marl layer. | 76.4864546190585 | 27.146983408799 | 76.4865880120726 | 27.1468647104361 |
| 6105 | RJPG-3 | 250 | 262 | Grey dolomitic marble and marl layer having tremolite . | 76.4865880120726 | 27.1468647104361 | 76.4866642366521 | 27.1467968827436 |
| 6106 | RJPG-3 | 262 | 268.65 | Variagated white siliceous dolomitic marble. | 76.4866642366521 | 27.1467968827436 | 76.4867064777732 | 27.1467592948796 |
| 6107 | RJPG-3 | 268.65 | 280 | Grey dolomitic marble and marl layerhaving tremolite . | 76.4867064777732 | 27.1467592948796 | 76.4867785735213 | 27.1466951411276 |
Sample Data from orezone.csv:
| sr_no | borehole_no | orezone_id | from_depth | to_depth | lon1_ | lat1_ | lon2_ | lat2_ |
|---|---|---|---|---|---|---|---|---|
| 215 | RJPG-3 | 1 | 155.05 | 156.05 | 76.4859848850874 | 27.1474013953794 | 76.4859912371357 | 27.1473957431004 |
| 216 | RJPG-3 | 2 | 156.05 | 157.05 | 76.4859912371357 | 27.1473957431004 | 76.485997589184 | 27.1473900908211 |
| 217 | RJPG-3 | 3 | 199.48 | 200.51 | 76.486267106593 | 27.147150264348 | 76.4862736492027 | 27.1471444424875 |
| 218 | RJPG-3 | 4 | 200.51 | 201.55 | 76.4862736492027 | 27.1471444424875 | 76.4862802553329 | 27.1471385641038 |
| 219 | RJPG-3 | 5 | 201.55 | 202.55 | 76.4862802553329 | 27.1471385641038 | 76.4862866073812 | 27.1471329118115 |
| 220 | RJPG-3 | 6 | 202.55 | 203.55 | 76.4862866073812 | 27.1471329118115 | 76.4862929594295 | 27.147127259519 |
| 221 | RJPG-3 | 7 | 203.55 | 204.55 | 76.4862929594295 | 27.147127259519 | 76.4862993114778 | 27.1471216072261 |
| 222 | RJPG-3 | 8 | 211.68 | 212.71 | 76.4863446015821 | 27.1470813063698 | 76.4863511441919 | 27.1470754845057 |
| 223 | RJPG-3 | 9 | 212.71 | 213.75 | 76.4863511441919 | 27.1470754845057 | 76.4863577503221 | 27.1470696061184 |
| 224 | RJPG-3 | 10 | 213.75 | 214.78 | 76.4863577503221 | 27.1470696061184 | 76.4863642929318 | 27.1470637842538 |
| 225 | RJPG-3 | 11 | 214.78 | 215.81 | 76.4863642929318 | 27.1470637842538 | 76.4863708355416 | 27.1470579623888 |
| 226 | RJPG-3 | 12 | 215.81 | 216.85 | 76.4863708355416 | 27.1470579623888 | 76.4863774416718 | 27.1470520840006 |
Here is my Code:
async function getData() {
f1 = await loadTable(“WRO-25291-2018/borehole.csv”);
f2 = await loadTable(“WRO-25291-2018/lithology33.csv”);
f4 = await loadTable(“WRO-25291-2018/orezone.csv”);
}
var borehole_long_lat = {}
var row = f1.split(“\n”);
for (var i = 1; i < row.length - 1; i++) {
var cells = row[i].split(",");
for (var j = 0; j < cells.length; j++) {
    borehole_long_lat[cells[1]] = [parseFloat(cells[2]), parseFloat(cells[3])]
    // console.log(borehole_long_lat[cells[1]][2])
}
}
var count = 1;
var latitiude = borehole_long_lat[cells[1]][0];
var longitude = borehole_long_lat[cells[1]][1];
var combine_data = “”
var row = f2.split(“\n”);
var row4 = f4.split(“\n”);
// console.log(row4);
    for (var i = 1; i < row.length - 1; i++) {
        // var row5 = row4[i].match(/(".*?"|[^",\s]+)(?=\s*,|\s*$)/g)
        var row2 = row[i].match(/(".*?"|[^",\s]+)(?=\s*,|\s*$)/g)
        console.log(row2[1])
        // if(row5[1]==row2[1])
        // {
        //     console.log(row5[1])
        // }
        // levelheight = borehole_long_lat[row2[1]][2]
        // console.log(levelheight,row2[2],row2[3])
    var data = `{"id":"${row2[1]} L ${count}","name":"${row2[1]} L ${count}",
    "description":"<p><b>Location: </b>${borehole_long_lat[row2[1]][0]}, ${borehole_long_lat[row2[1]][1]}<p><b>Start: </b>${row2[2]}</p><p><b>End: </b>${row2[3]}</p></p><p><b>Length: ${row2[3]-row2[2]}</p><p><b>DESCRIPTION: </b>${row2[4].replaceAll('"','')}</p></p>",
    "polyline":{
        "positions":{
            "cartographicDegrees":[${[row2[5]]},${[row2[6]]},-${(row2[2])},${[row2[7]]},${[row2[8]]},-${(row2[3]-0.1)}]},
            "width":10,
            "material":{
                "polylineOutline":{
                    "color":{
                        "rgba":[253,218,13,255]}}}}},

    {
        "id":"${row2[1]} L ${count}.1","name":"${row2[1]} L ${count}",
        "description":"<p><b>Location: </b>${borehole_long_lat[row2[1]][0]}, ${borehole_long_lat[row2[1]][1]}<p><b>Start: </b>${row2[2]}</p><p><b>End: </b>${row2[3]}</p></p><p><b>Length: </b>${row2[3]-row2[2]}</p><p><b>DESCRIPTION: </b>${row2[4].replaceAll('"','')}</p></p>",
        "polyline":{
            "positions":{
                "cartographicDegrees":[${row2[7]},${row2[8]},-${(row2[3]-0.1)},${[row2[7]]},${[row2[8]]},-${row2[3]}]},
                "width":10,
                "material":
                {
                    "polylineOutline":
                    {
                        "color":
                        {
                            "rgba":[255,0,0,255]}}}}},`

    // end = i == row.length - 1 ? "\n" : ",\n"
    end = i == row.length - 2 ? "\n" : "\n"
    combine_data += data + end
    count += 1
    }
var count3 = 1
var row4 = f4.split(“\n”);
var orezone_name = “”;
var orezone_data = “”;
var start = “”;
var end = “”;
var long_lat = “”;
for (var i = 1; i < row4.length - 1; i++) {
    var row5 = row4[i].match(/(".*?"|[^",\s]+)(?=\s*,|\s*$)/g)

    orezone_name = row5[1];
    orezone_data = row5[2];
    start = row5[3];
    end = row5[4];
    long1 = row5[5];
    lat1 = row5[6];
    long2 = row5[7];
    lat2 = row5[8];
    // console.log(orezone_name,orezone_data,start,end,long1,lat1,long2,lat2)


    var data = `{"id":"${orezone_name} Orezone No.: ${orezone_data}","name":"${orezone_name} Orezone No.: ${orezone_data}",
“description”:“
Location: ${long1}, ${lat1}
Start: ${parseFloat(start).toFixed(2)}
End: ${parseFloat(end).toFixed(2)}
Length: ${(end-start).toFixed(2)}
”,“polyline”:{
“positions”:{
“cartographicDegrees”:[${long1},${lat1},-${start},${long2},${lat2},-${end}]},
“width”:12,
“material”:
{
“polylineOutline”:
{
“color”:
{
“rgba”:[0,0,255,255]
}
}
}
}
}`
    end = i == row4.length - 2 ? "\n" : ",\n"
    combine_data += data + end
    json1 = data.replace(/[^,{[](?=\n *["[{\d])/gm, '$&,');
    count3 += 1
    // console.log(row3.length)
}
final_data = [{"id":"document","name":"CZML Geometries: Cones and Cylinders","version":"1.0"},${combine_data}]