There’s not a lot of information to go on, here. But the error message points to some sort of out of memory issue. Can the user share steps to reproduce the error? I imagine they’re maybe doing something like loading in a very large 3D model, or a very large data source maybe.
Without a more explicit stack trace, however, it’s impossible to say for certain. Does your app have a debug mode where it can run an unminified / debug version of Cesium, so we can get an actual stack trace?
Oh also, if possible, perhaps try upgrading Cesium versions. 1.108 is, at this point, ~2 years old, so this issue could potentially solve itself with a newer version.
They are running our app and then it crashes after running for about 15 minutes they say with this error. Their machine is 2 years old and has 8G RAM running Windows.
Thanks for suggesting that. Do you happen to know what version (highest) should work with Windows 10 CoreWebView2 ? I have tried more recent versions but there seems to be issues.
Yes, I think it’s safe to say the syntax has probably changed from version 1.108 - you can take a look at some gallery examples in sandcastle to compare.
I don’t know the answer to your compatibility question, but I think the latest Cesium versions should be compatible. I think the issues you’re having may be more to do with updating API usage to be consistent with changes to Cesium.
They are running our app and then it crashes after running for about 15 minutes they say with this error. Their machine is 2 years old and has 8G RAM running Windows.
The memory exhaustion I’m referring to isn’t really a factor of their machine. It indicates either a memory leak (which is a bug we would want to know about), or a really large workflow of some sort (I’m being vague because there just isn’t enough information in the error to go off of - see my first message about using a development build to get a better stack trace).
Update: I solved the globe not displaying issue and cross-origin error messages in the browser dev too by (and this is for Windows UWP app using WebView2 to host Cesium) making the local html file be hosted via a virtual host using core_wv2.SetVirtualHostNameToFolderMapping.
Using the latest Cesium .133 works just fine again now. I suppose in .109 y’all changed the hosting on your side to support the cross-origin security feature.
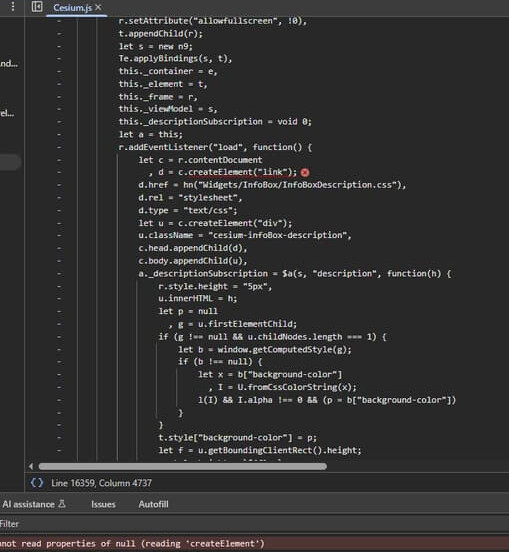
I do still have the question about the Cesium.js:16359 Uncaught TypeError: Cannot read properties of null (reading ‘createElement’) shown in the picture below - what is that about and how to fix ?
OLD:
I started using Chrome dev tools, in regard to the globe not showing, to look at how .108 works as compared to .109 up through .133. I am noticing I am getting Refused to cross-origin redirects of the top-level worker script. starting with .109 where the globe doesn’t show and .133 has the same issue as seen.
What should I do in my html to get rid of this error ? And is this why the globe isn’t showing up ?
Also, note the
Cesium.js:16359 Uncaught TypeError: Cannot read properties of null (reading ‘createElement’). This happens on all I try also - how does one get rid of that ?
Hi @SpaceStation22, I’m glad you got the cross-origin issues fixed. For the Uncaught TypeError: can you expand the error message to show the full stack trace? It should include more information about where the error was thrown from.
Hi again, so the user is using the new version of the app that is using 1.133. Instead of getting the js rendering error and stoppage after about 15 minutes, the error now happens at 45 minutes.
I can see from a screenshot of the user’s screen that the memory usage is 15G whereas when most people run the app it only use 1.5 G.
While cesium is being hosted in the Windows UWP app in a WebView2 (Edge), how can one best set this up for some further debugging ?
In general, the user is only tracking 1 satellite whereas I can easily track 50+ with no problem. So it seems something particular with their machine setup.
To be able to do any useful debugging, you’ll need to get a better stack trace. How to get this can depend on your app’s setup (the detail of which I do not know).
In general, though, you need to be using an unminified version of CesiumJS to get a more descriptive stack trace. We ship both Build/Cesium/Cesium.js and Build/CesiumMinified/Cesium.js - the former also has debug logs (which get stripped out in the minified build). But, if you’re building Cesium from source, then how to use the unminified source will be completely dependent on your build tooling.
I am not sure why, but both my laptop and desktop no longer show the uncaught type error - so the issue is now moot. You can see the stack in the above bitmap. Here it is also.
I’ve also got a client getting this error, the call stack they sent me in a photo of their screen is:
RangeError: Array buffer allocation failed
at new ArrayBuffer ()
at new Float64Array ()
at PrimitivePipeline.packCreateGeometryResults
at async onMessageHandler