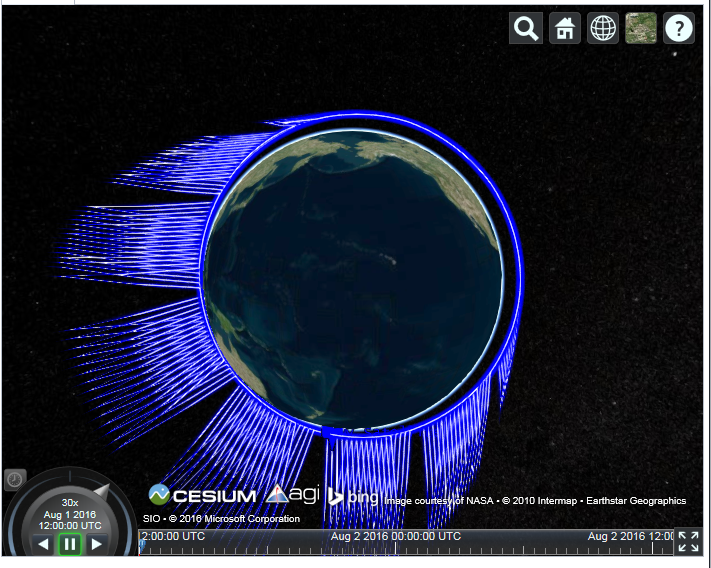
I’m trying to plot the location a satellite along with it’s orbit track. My points seem OK to me, but the track either will not plot or plots with bizarre artifacts.
Attached is an extract of some code that I was able to copy to sandcastle to reproduce the issue. The track is clearly wrong, but is it my bug or Cesium’s?
I will add depending on what satellite I propagate, sometimes the line just doesn’t plot at all. Changing lead and trail times can also cause the track to simply not plot.
IMO, your coordinates array returned via ‘getECIArray()’ is really all over the map (literally) and what you see in the screenshot looks right with altitudes jumping from negative to positive and back again.
In order to keep the sample code short, I selected at 10 minute steps, but I see identical results using 1 minute steps. If you look at the actual distance traveled between two samples, and divide by the time step, you’ll see that satellite is moving at a bit over 7300 meters/second. I’m no orbital mechanics expert either, but that seems reasonable for a LEO to me… I also plotted the magnitude of (X, Y, Z) in Excel, and it’s a smooth curve there. (as smooth as you can get with a 10 minute sample rate anyway…)