Cesium users can host and stream different kinds of source data, and combine different data sources in their runtime applications in meaningful ways. Two important types of data are 3D Tiles tilesets that contain geometry data in a geospatial context, and raster imagery, like aerial photographs or sattelite imagery. Until now, CesiumJS allowed users to drape raster imagery on the globe or terrain data. But soon, it will also be possible to drape imagery on 3D Tiles tilesets.
The feature has been requested by several users, in order to support a variety of use-cases. Now there is a draft pull request that shows the progress of implementing this feature.
Check out the following sandcastles for a live preview of the current state of the implementation:
We’re curious to hear your feedback. You can post your thoughts either here in the community forum, or directly in the pull request. The feature is supposed to become part of the next release of CesiumJS, and we will try to take into account any feedback that is given by the end of next week.
No - at least, not yet. This is a broader question, referred to as “upsampling” in the PR, issue, and the follow-up issue of this feature. Right now, it is selecting an imagery texture based on the overall size of the primitive - namely, to drape one texture on each primitive. To use higher-resolution imagery, it will be necessary to split the geometry of the primitive into multiple parts. For point clouds in particular, that could be relatively easy, but still, the infrastructure that is required for that has a large overlap to the infrastructure that will be required for the case of triangle meshes.
If I understand correctly, this would add a lot of value.
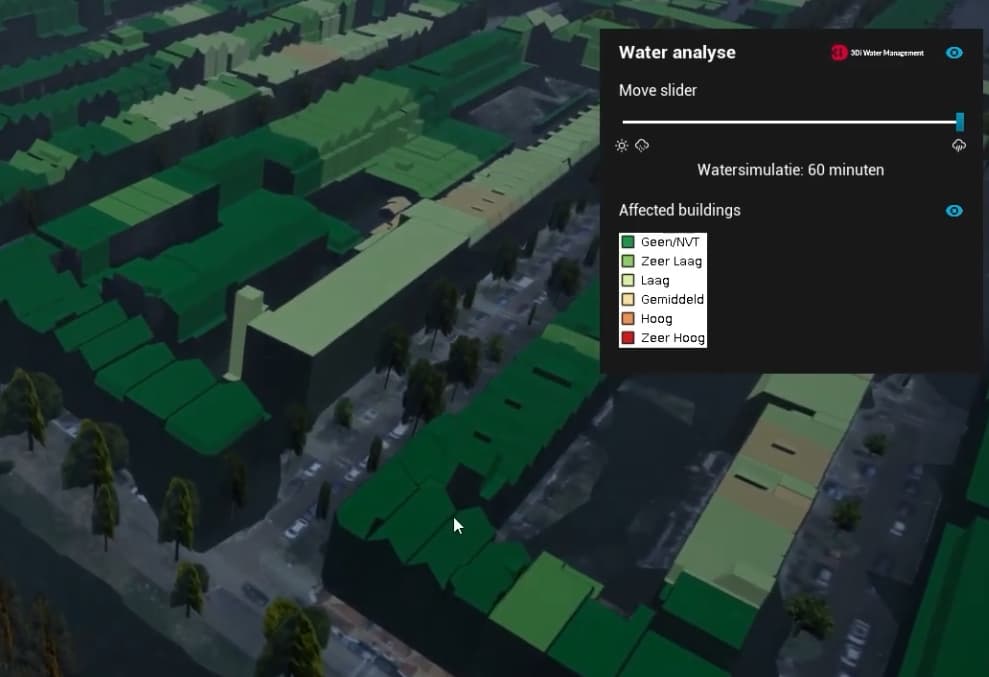
Am I correct to say that it’s difficult now to style 3D tiles in CesiumJS based on external data the way you might do when you do with 2D GIS maps? This draping would provide a solution to reach mostly the same effect. For example, if you have a 3D tileset with buildings and a WMS that shows risk of flooding per building, you just drape the WMS over the tileset to visualise it in 3D. The attached photo is an example of this in Unreal Engine. I’m not a programmer so excuse me if I misunderstand.
@Jorri Exactly! That’s one of the many use cases of this feature. There are many possible sources for imagery data, be it statistical data, or meteorological data that is gathered with special drones or sattellites. And the goal is to seamlessly integrate this for all sorts of analysis- and information visualization tasks. There’s still some work to do for this. For example, the ‘upsampling’ that may be required, or the fact that the current state of the draping does not work together with ‘outline rendering’, which means that it unfortunately cannot be applied to the OSM buildings. But we hope to make some progress here soon and will update this thread with progress reports, bugfixes, and possibly new showcases.