Hi guys,
I would like to know from you experts if you can think of the best way of displaying a contour plot on a flat surface in cesium.
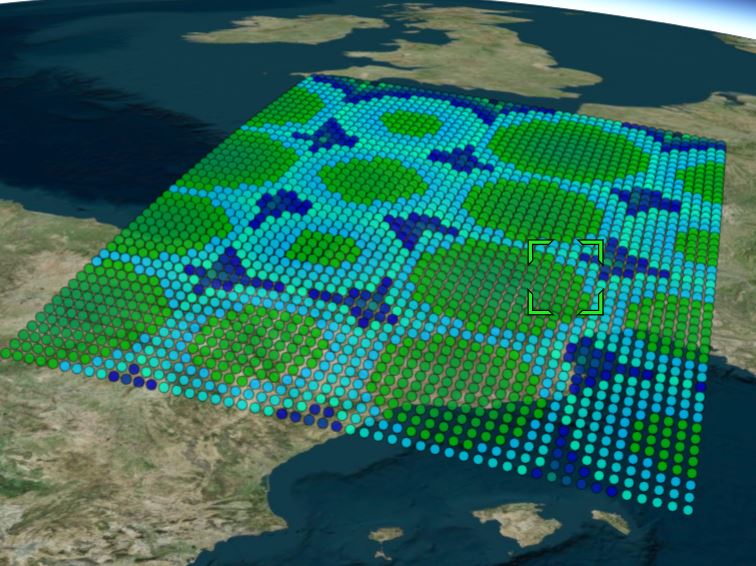
For a set of points in lat and long I want to plot the value of variable.
This is what I have at the moment; the color of a cesium point is defined by the value of the variable. And it’s pretty ugly.
I’m using a geojson data source and plotting the colour from entity.properties. I’m running a python backend so could produce some contours from scipy and plot them as polylines?
Any directions would be appreciated!
 .
.