I’ve recently upgraded my project’s Cesium plugin to the latest (2.19.1) and have had tons of fun discovering how to use the new GeoJSON features. In this time, I’ve been able to load polygons using raster overlays from both local file storage, as well as Cesium Ion at runtime. Though I haven’t had much success with styling the polygons yet, I’ve seen others in the Cesium for Unreal community who have succeeded. I honestly just haven’t put enough effort into it yet. I’ve also been able to read and parse GeoJSON documents from Cesium Ion at runtime as well.
My question is, as there is good support for visualizing polygons at the moment, will there be more support for visualizing other features? i.e. (multi) Points, (multi) Line Strings, or even collections of geometries/features? Notably, I am looking to do this at runtime.
I’ve spent a good bit of time looking at the File Reference where GeoJSON is mentioned, and I’ve found that they are supported in ECesiumGeoJsonObjectType, but I’m unaware on how to visualize these (if the functionality even exists through Cesium for Unreal). If these functionalities to visualize at runtime don’t exist yet, I’ll be able to come up with my own methods of visualizing my data, but thought it would be smart to reach out to the community before going down this path.
If I’m missing something really obvious, I apologize, but I also haven’t found much documentation on this at all, so am figuring this all out on the fly. I’d greatly appreciate if anyone could point me in the right direction regarding visualizing these other geometries/features.
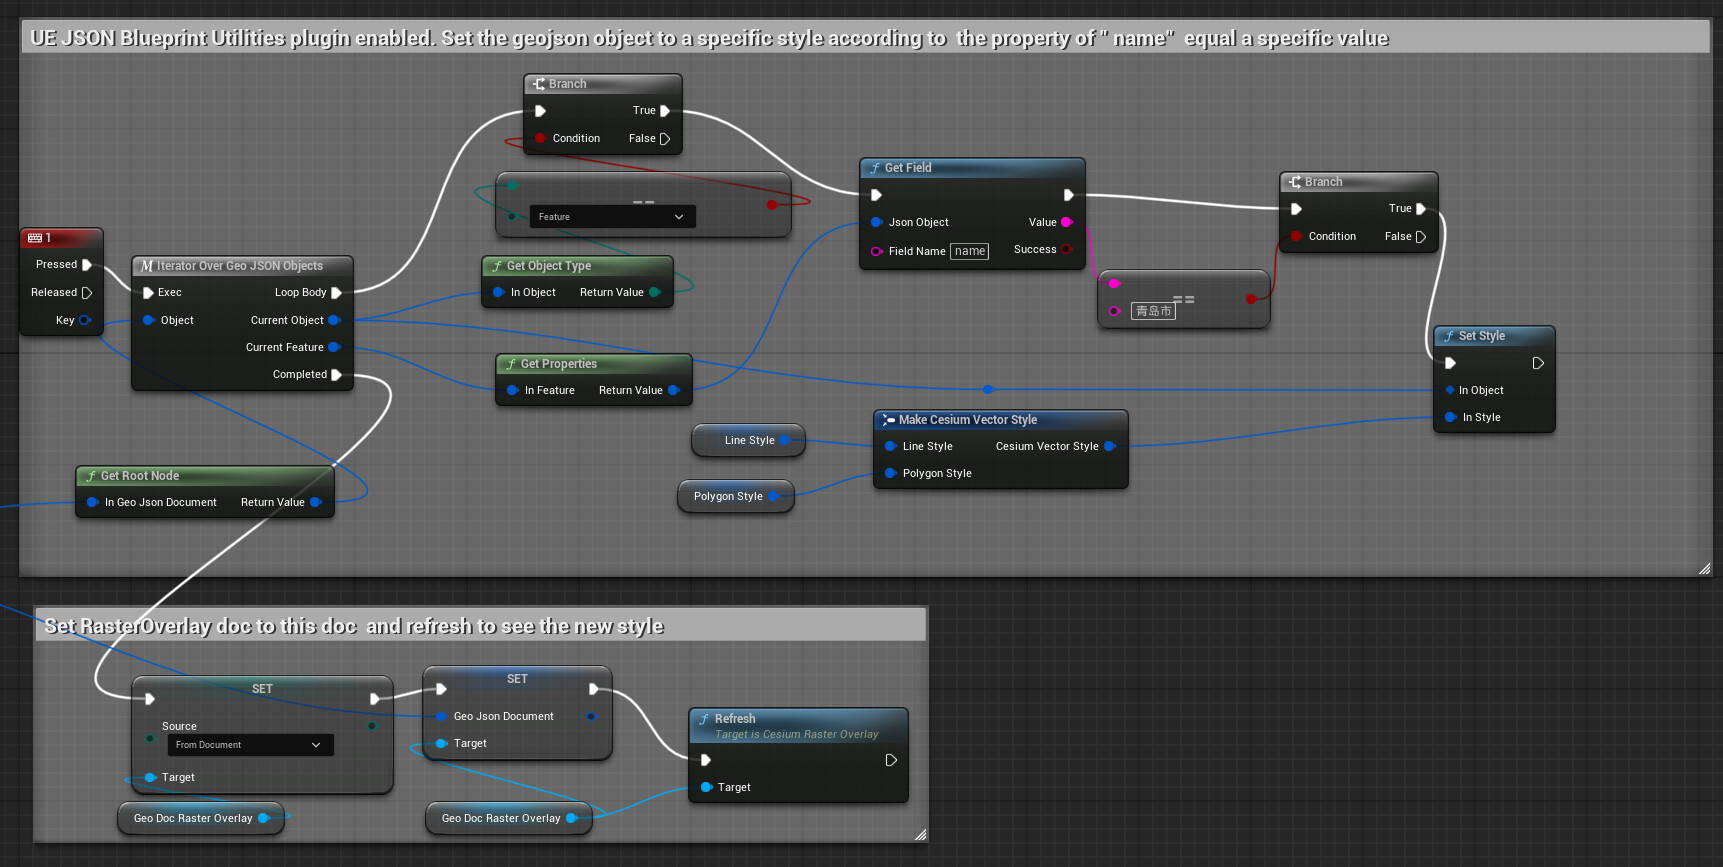
The method is to iterate each JSON object , locate the specific feature or property you want, and set it to another style.
If the style is set on the GeoJSON Document, associate the GeoJSON Document with the RasterOverlay, then refresh the GeoJsonDocRasterOverlay. This will allow you to see the new style immediately.
If the style is set in the “On Document Loaded” delegate, you can refresh the RasterOverlay in the main thread of the program to see the new style immediately.
@tyleraa To explain some background behind the above, the current solution for visualizing GeoJSON in Cesium for Unreal is to use a GeoJsonRasterOverlay. This drapes the GeoJSON data over the terrain and has the ability to customize the styling of that data programmatically as described above. Currently, lines and polygons are supported. Points are not directly supported by the GeoJsonRasterOverlay (I’m not entirely clear what a good default path for rasterizing points would be - just as circles?), but you can iterate through the GeoJSON document to find any points and handle them as you’d like. For most users, this seems to be spawning things at those points, such as actors or markers.
We are exploring other approaches to visualizing vector data in Cesium for Unreal. If there’s something in particular you’d like to do that doesn’t seem to be currently supported, please let us know!