Hello, everybody:
I’m working at a project based on Cesium. Now, I have many points of an area, which have x,y coordinate and value about representing pm 2.5 density.
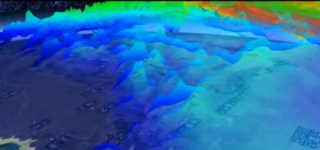
I want to visualize these points in Cesium with heatmap as below, and like elevation, the value of one area is bigger, it’s also higher.
But I don’t know how to do it. Could you help me and give me some clues about this? Looking forward to you reply, thank you very much!
Chad

