Hi, Is it possible to connect CesiumJS to RenderDoc to review and debug the mesh information in a scene. I’ve successfully connected RenderDoc to my app but I don’t seem to be able to view the building geometry in my 3DTiles following a capture. Steps to reproduce:
- Command line instruction to configure RenderDoc for capture:
set RENDERDOC_HOOK_EGL=0
- Command line instruction to connect to app and display process PID (Don’t click OK in popup):
"C:\Program Files (x86)\Google\Chrome\Application\chrome.exe" http://localhost:8080/ --disable-gpu-sandbox --gpu-startup-dialog
- Inject process in RenderDoc.
- Press ‘OK’ in PID popup.
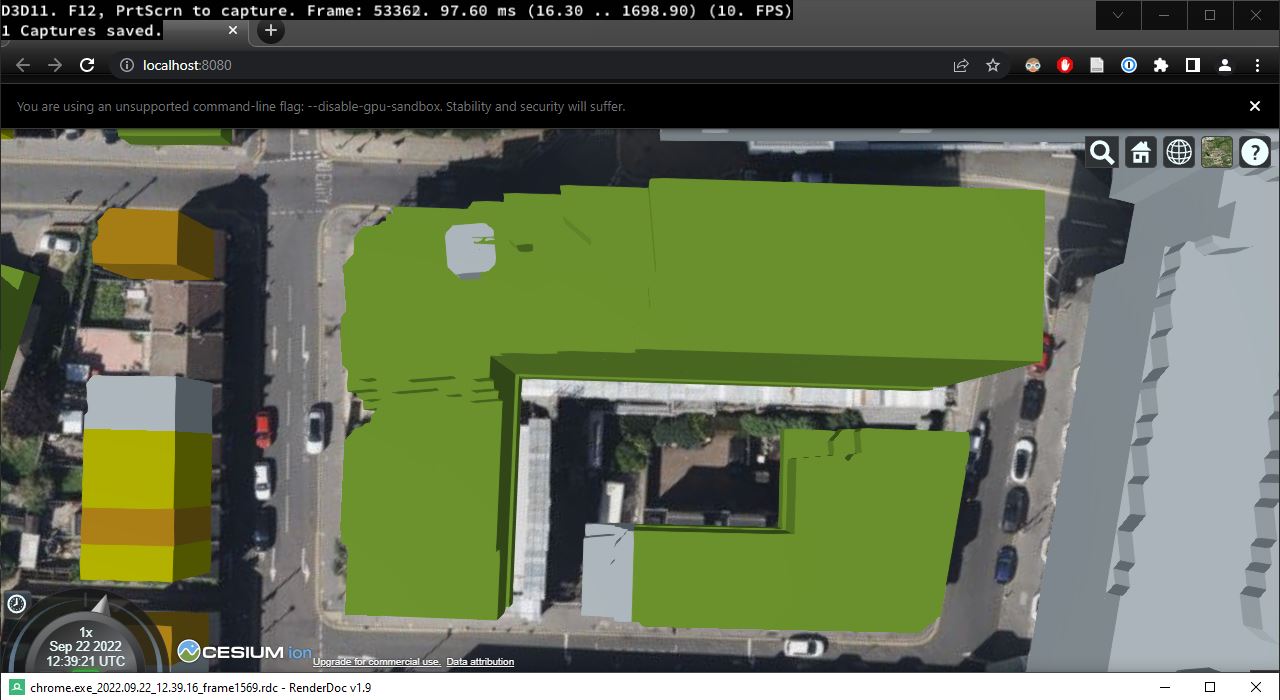
- Capture and review scene.
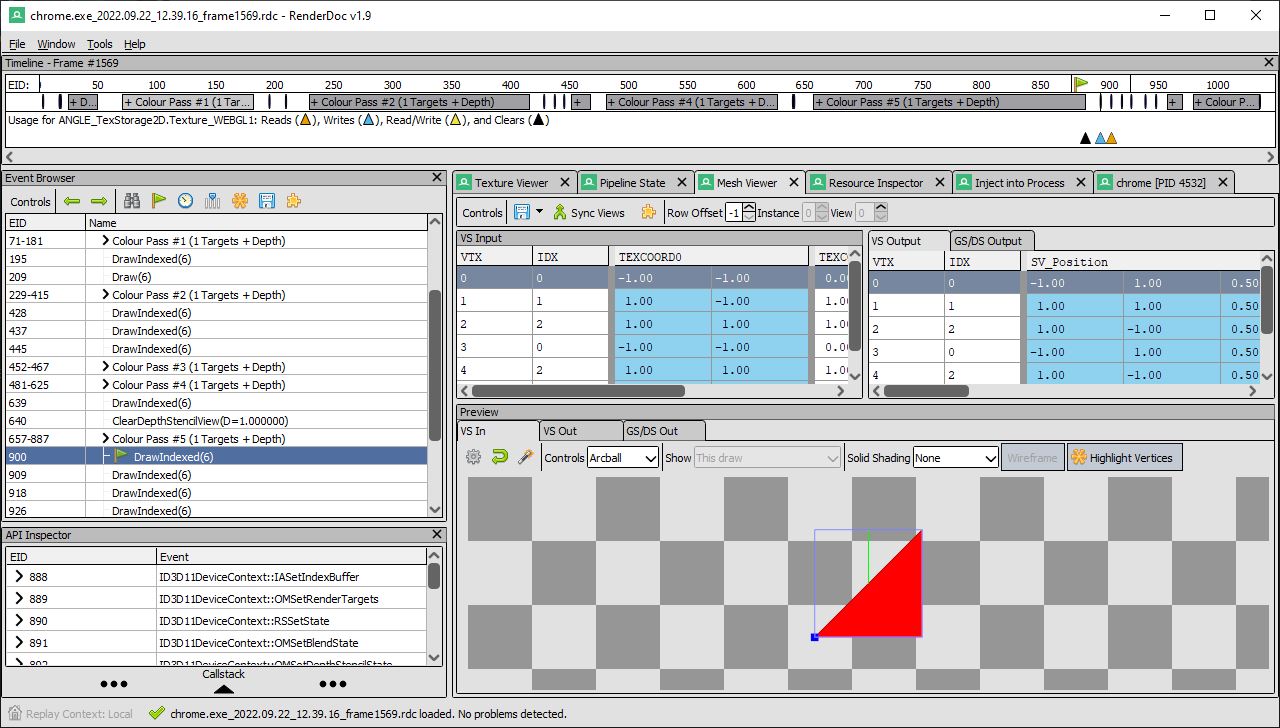
I was expecting to be able to see the meshes from the capture. I was also hoping to determine whether object IDs and any semantic properties were visible as this could be a security issue if sensitive information is linked to those geometries.
